Artemis Health • Cost Advisor
How can we allow benefits consultants to focus solely on quality member coverage and accurate budgeting by eliminating manual processes?
Summary
Artemis Health offers a comprehensive healthcare analytics suite designed to empower U.S. employers and their advisors in optimizing health benefits through data-driven insights. A significant challenge for benefits consultants is the labor-intensive process of tracking monthly expenditures on medical and prescription claims, which is essential for accurate cost forecasting. Traditionally, compiling these reports is a time-consuming endeavor, often taking weeks each month due to repetitive and manual tasks.
Role: User Experience Research and Design
Collaborators: Product Manager, Two Software Developers
Collaborators: Product Manager, Two Software Developers

Discovery
We began the project with a basic understanding of the monthly and annual budget reporting requirements inherent to healthcare consulting. Our hypothesis centered on the idea that streamlining the report-building process by minimizing manual data entry would significantly enhance efficiency. We conducted job shadowing sessions with 5 different users, having them walk us through the process of creating a monthly report for a range of varied clients (by size and industry) while interviewing them throughout the process for better clarity. In doing so we gained 3 key takeaways:
1•Collecting the data for budget spend is repetitive. Based on client size, a consultant would have to collect data from between 5 to over a dozen separate sources, and these were collected every month.
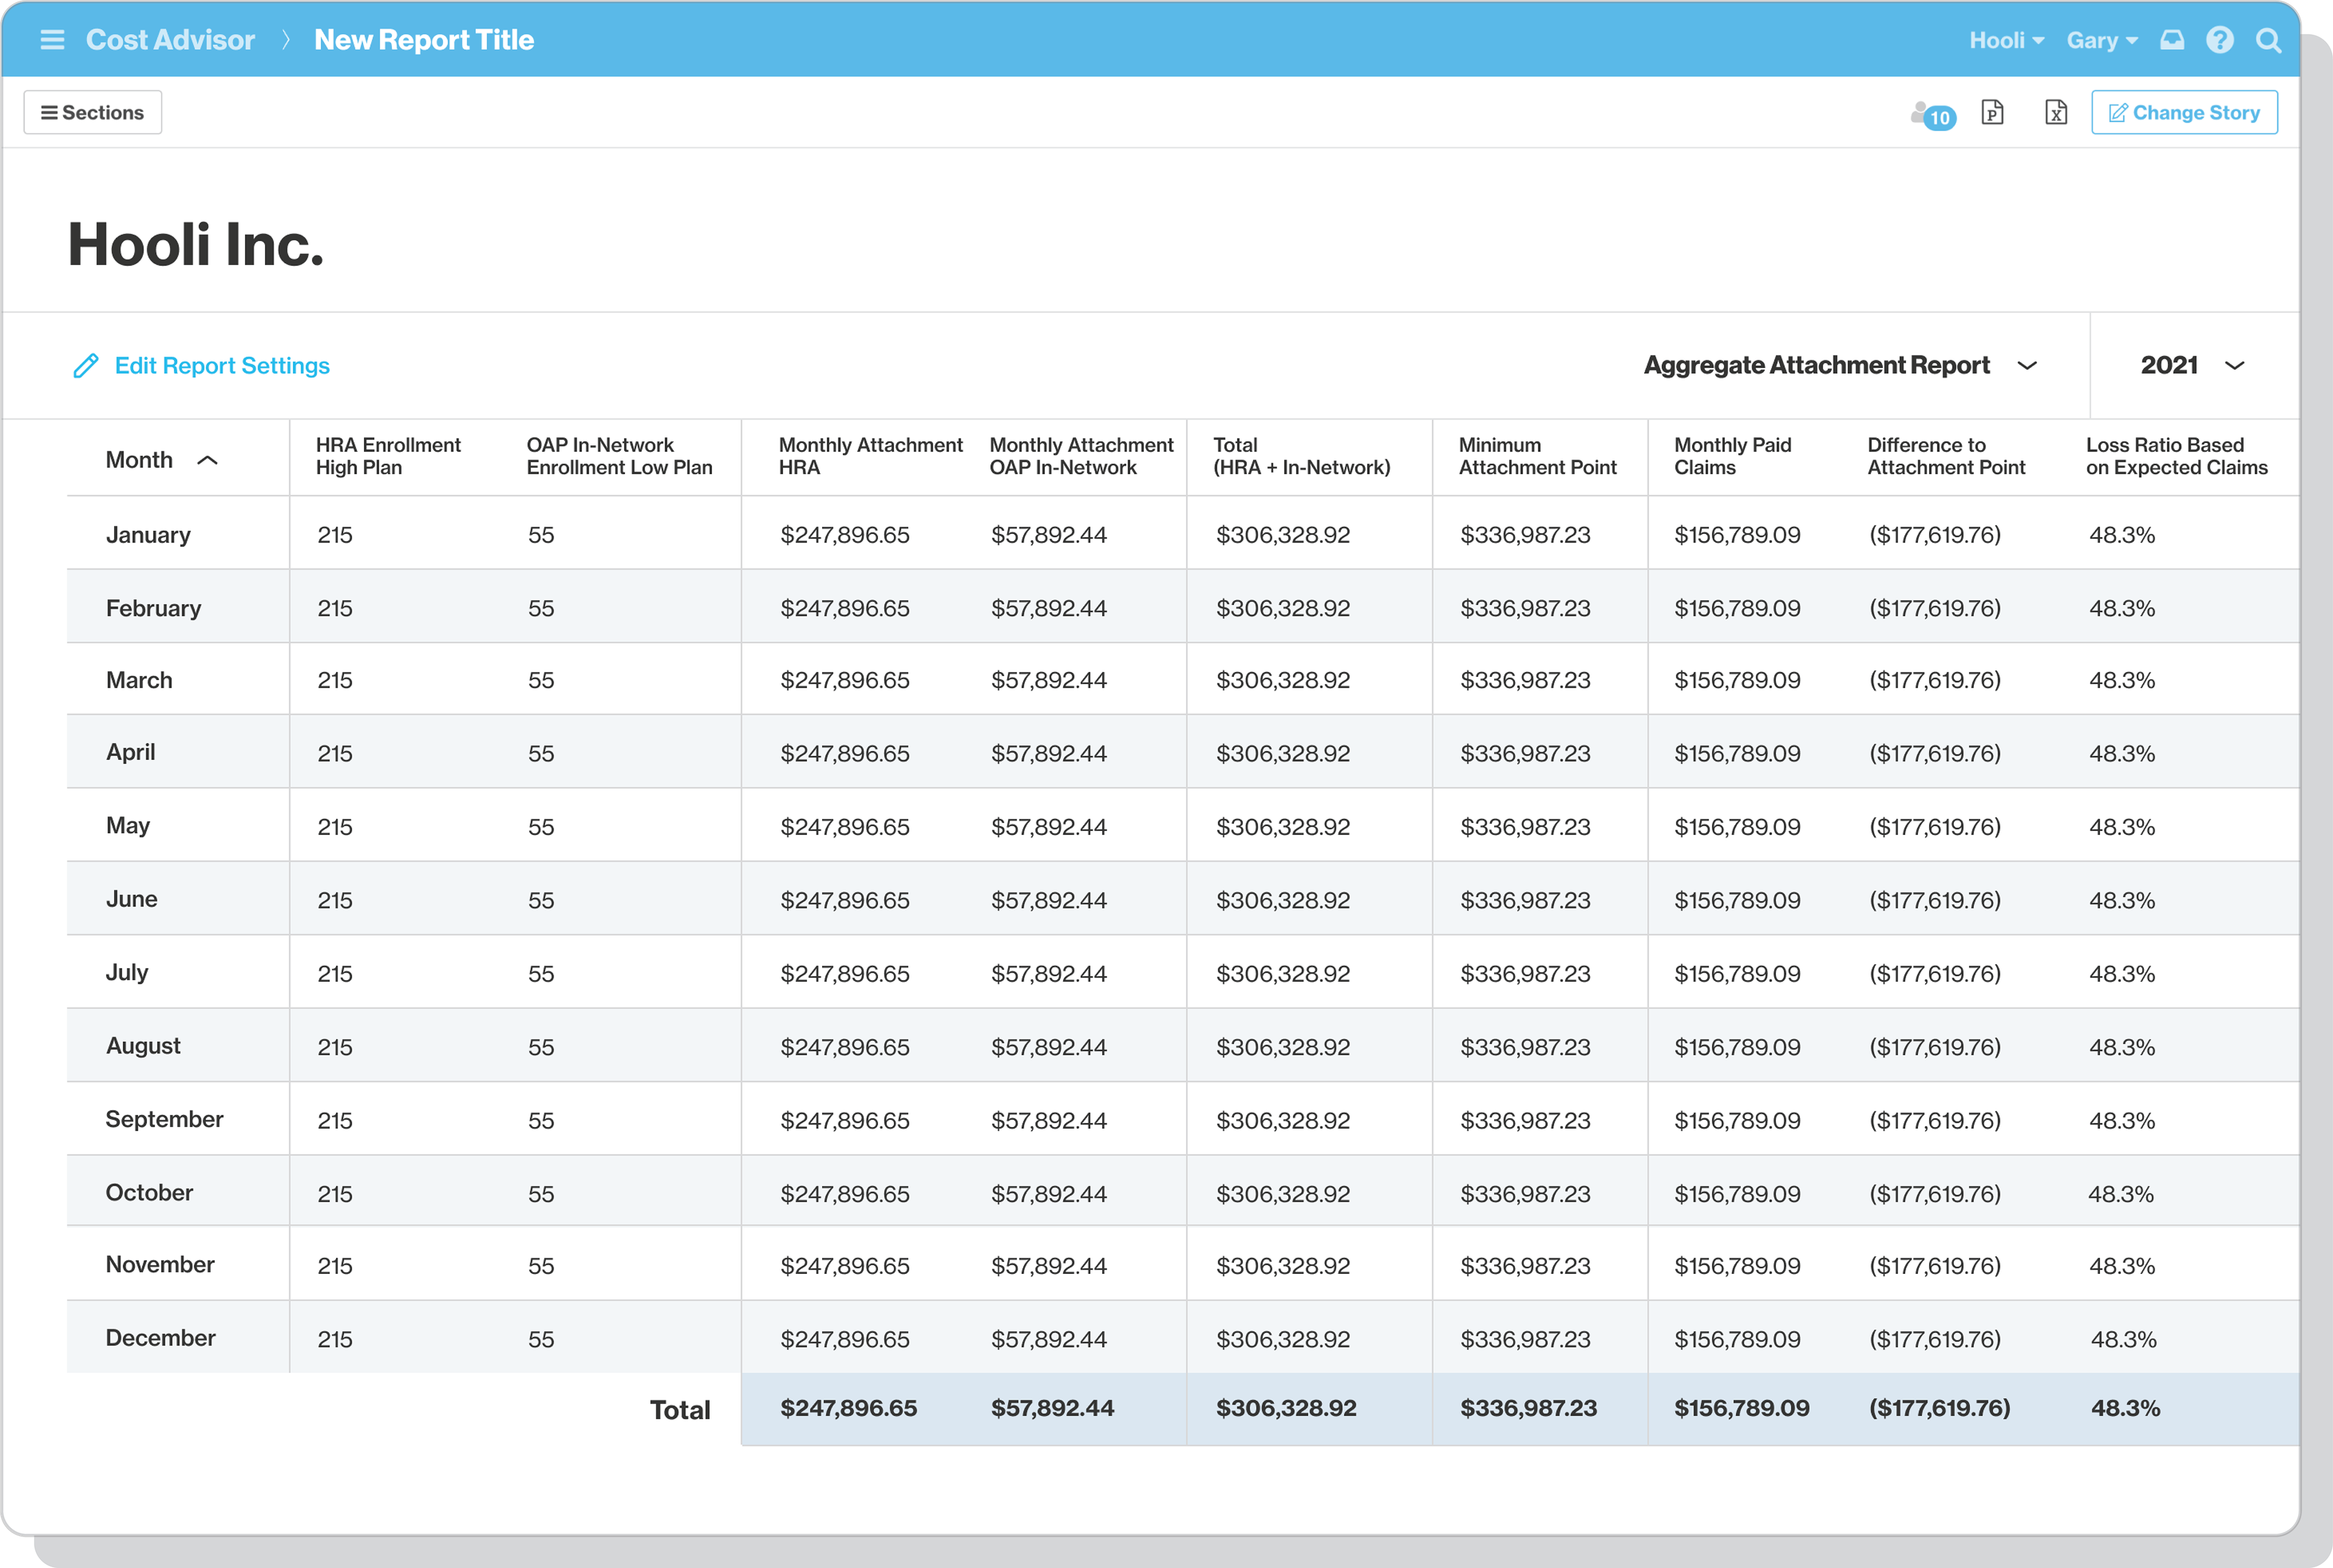
2•Calculating multiple data feeds against the annual budget is incredibly complicated, and carried out manually. Comparing dollars spent against the budget was always done within a proprietary spreadsheet crafted by a consultancy in order to run various formulas across all of the claims data.
3•Preparing the data is just a prerequisite for creating the reports their clients hire them for. It wasn’t until after weeks of data prep that these consultants were actually able to start creating reports and crafting a narrative for their clients around how benefits dollars were being spent.
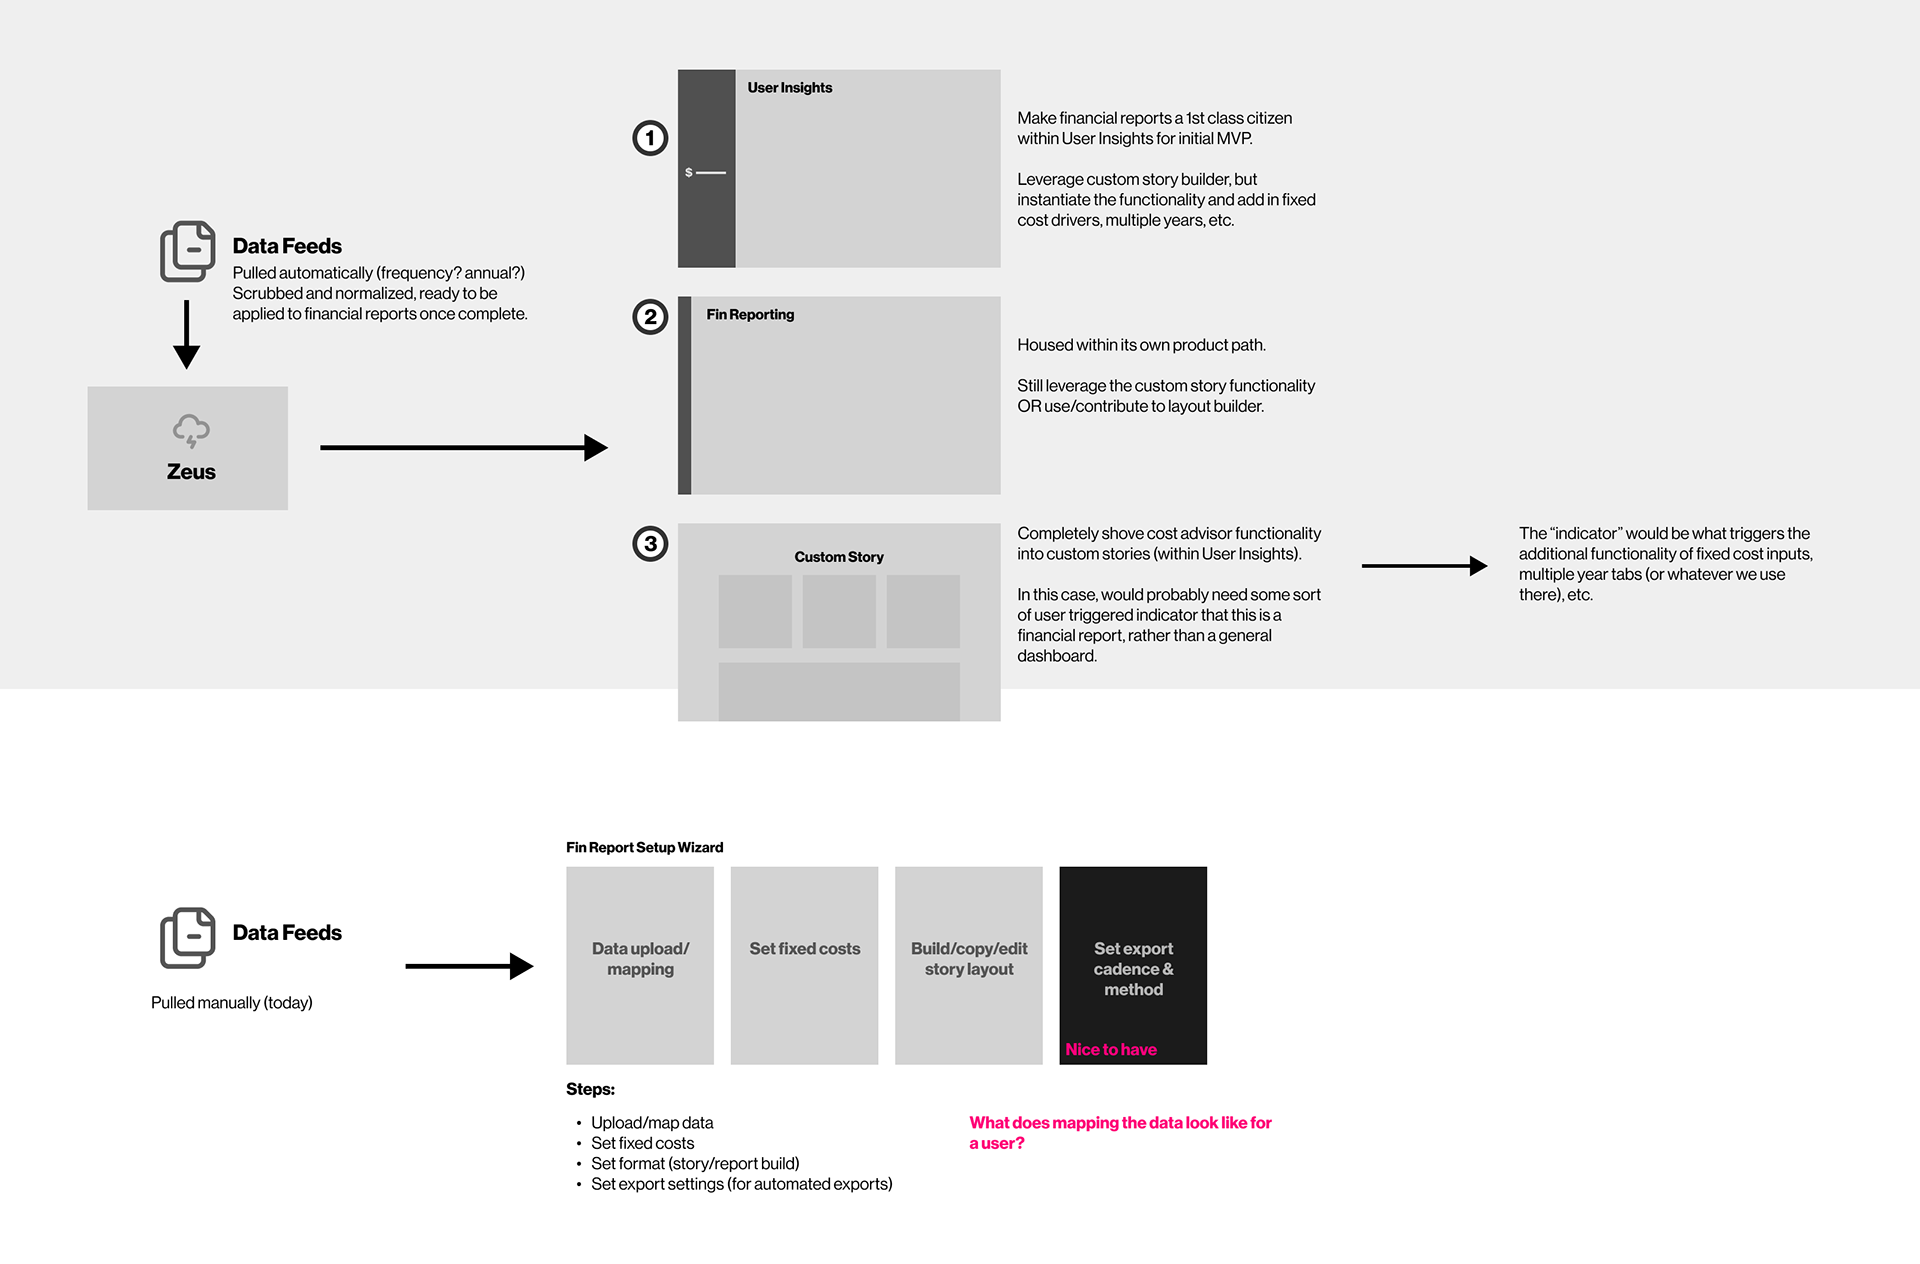
Brainstorming
At this point my product manager and I had a good grasp of the problems we needed to solve, but our first step of solutioning was to prioritize their order, refining our definition of our MVP. We approached this first by synthesizing the data from discovery on a virtual whiteboard (Miro in this case) and ranking each feature.
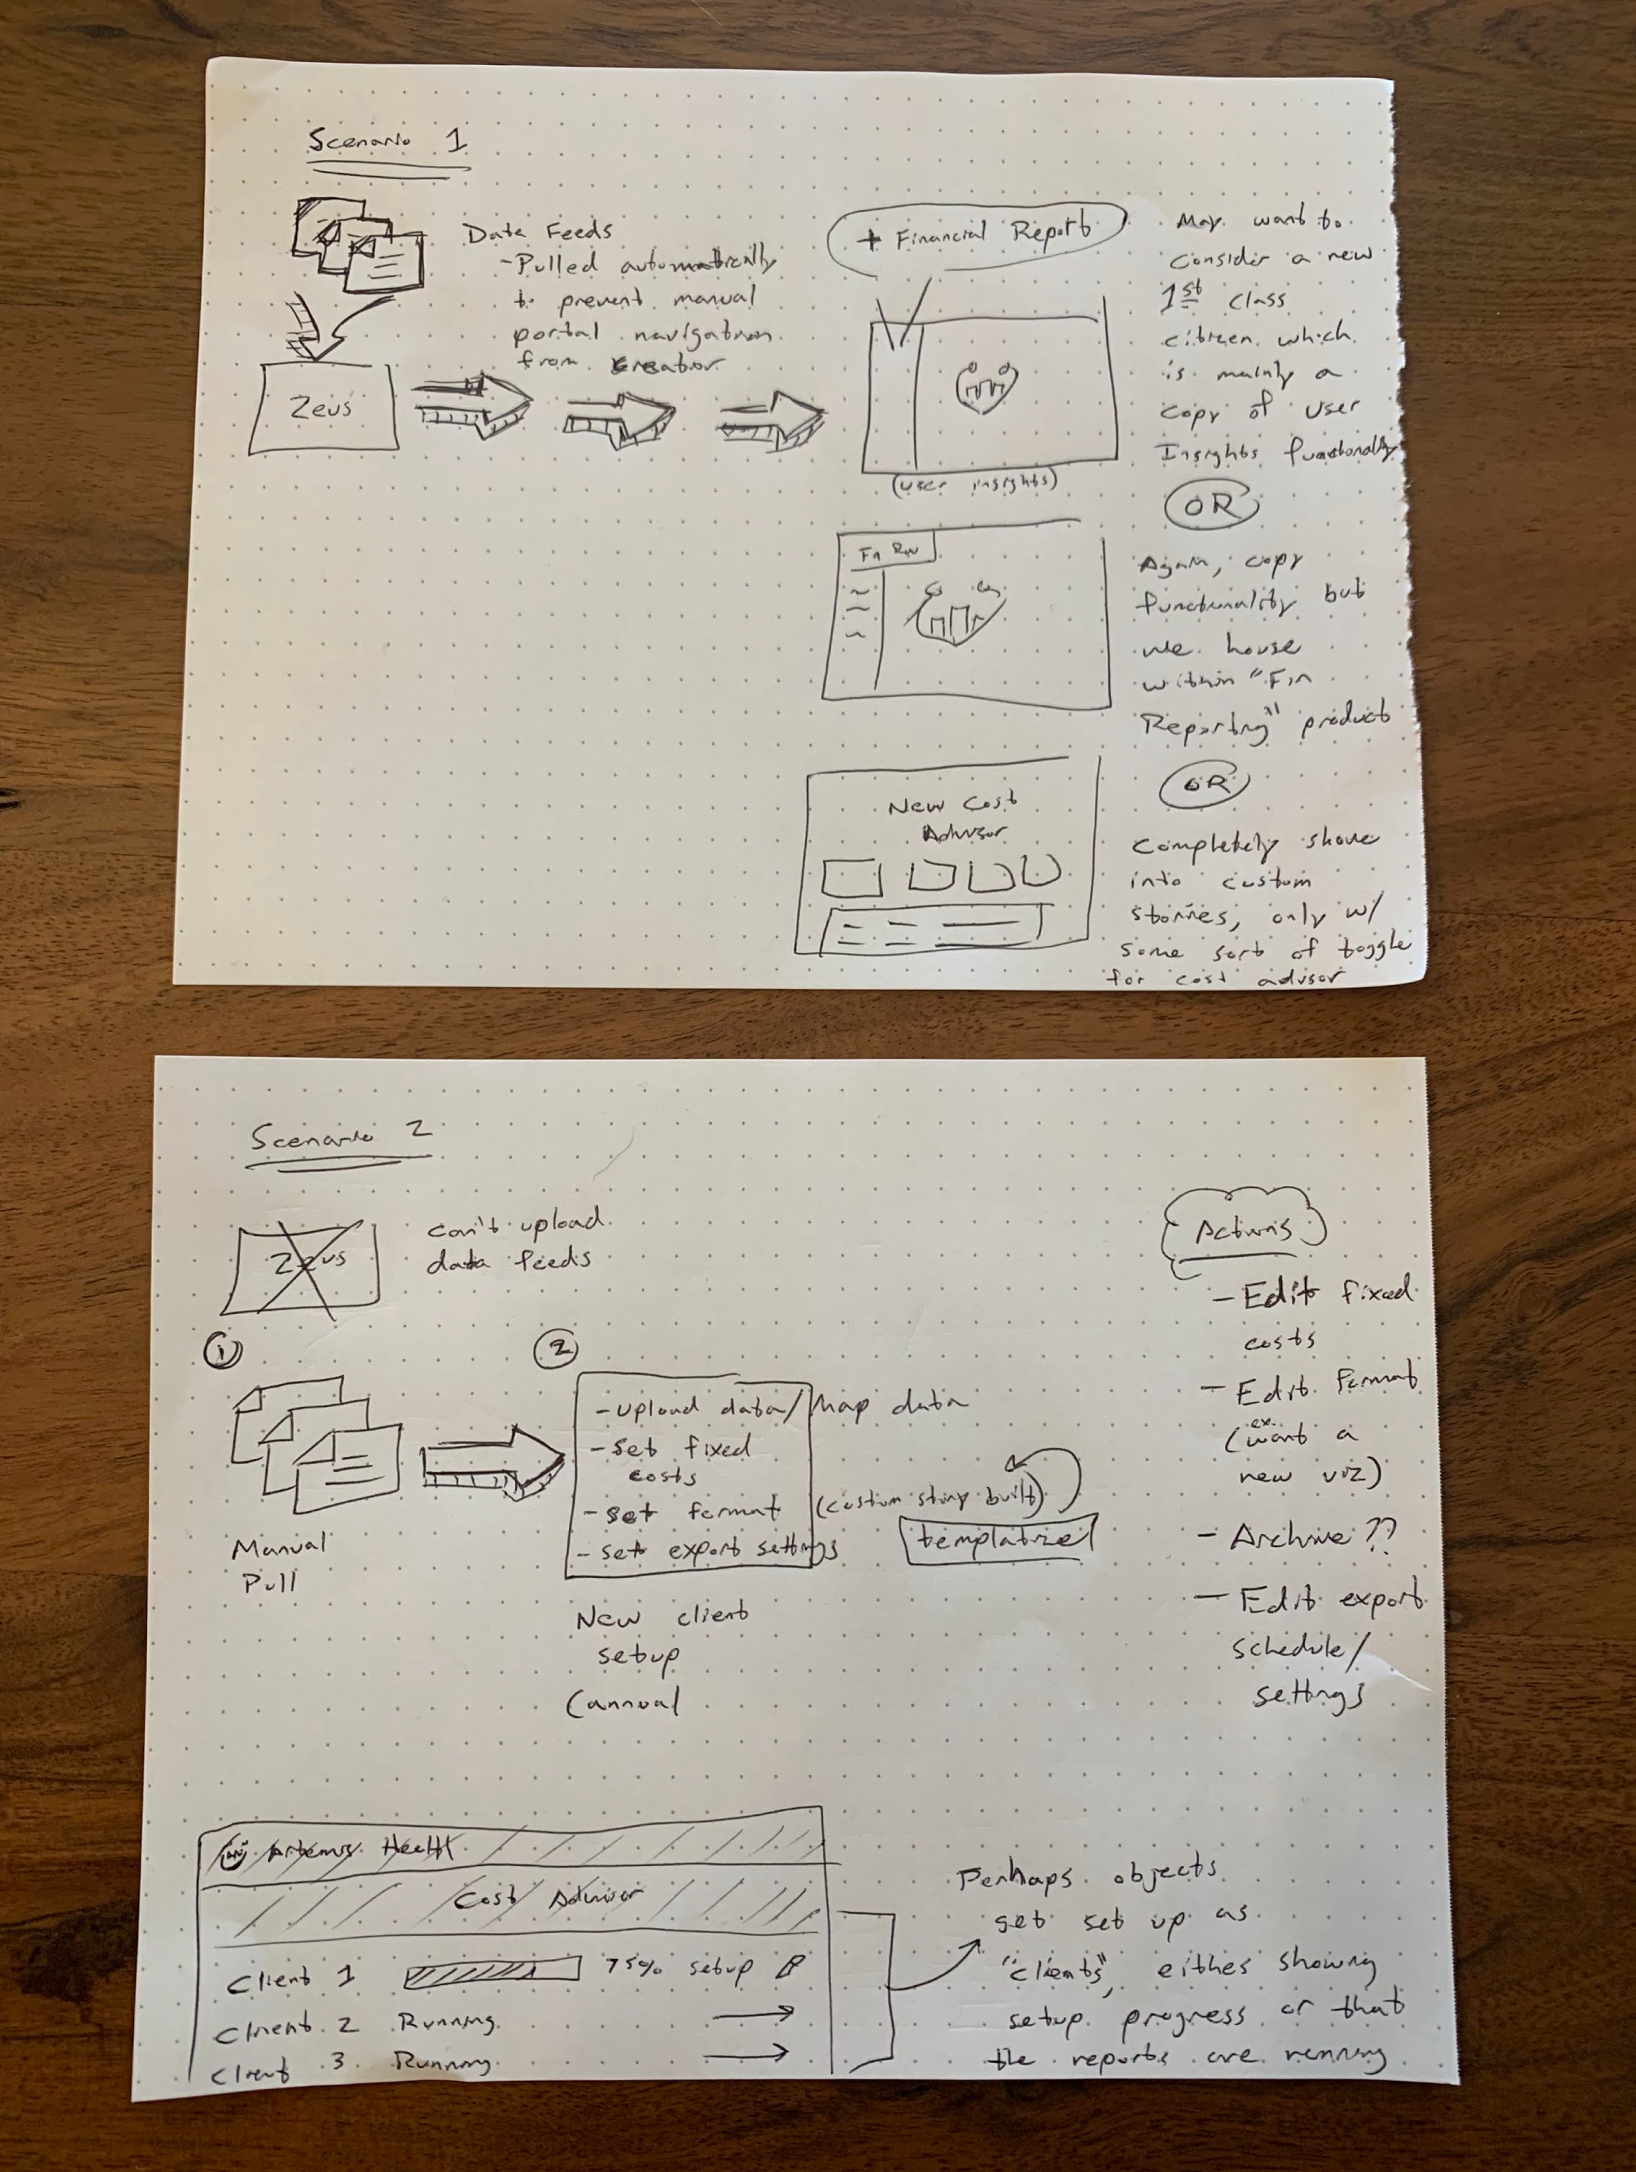
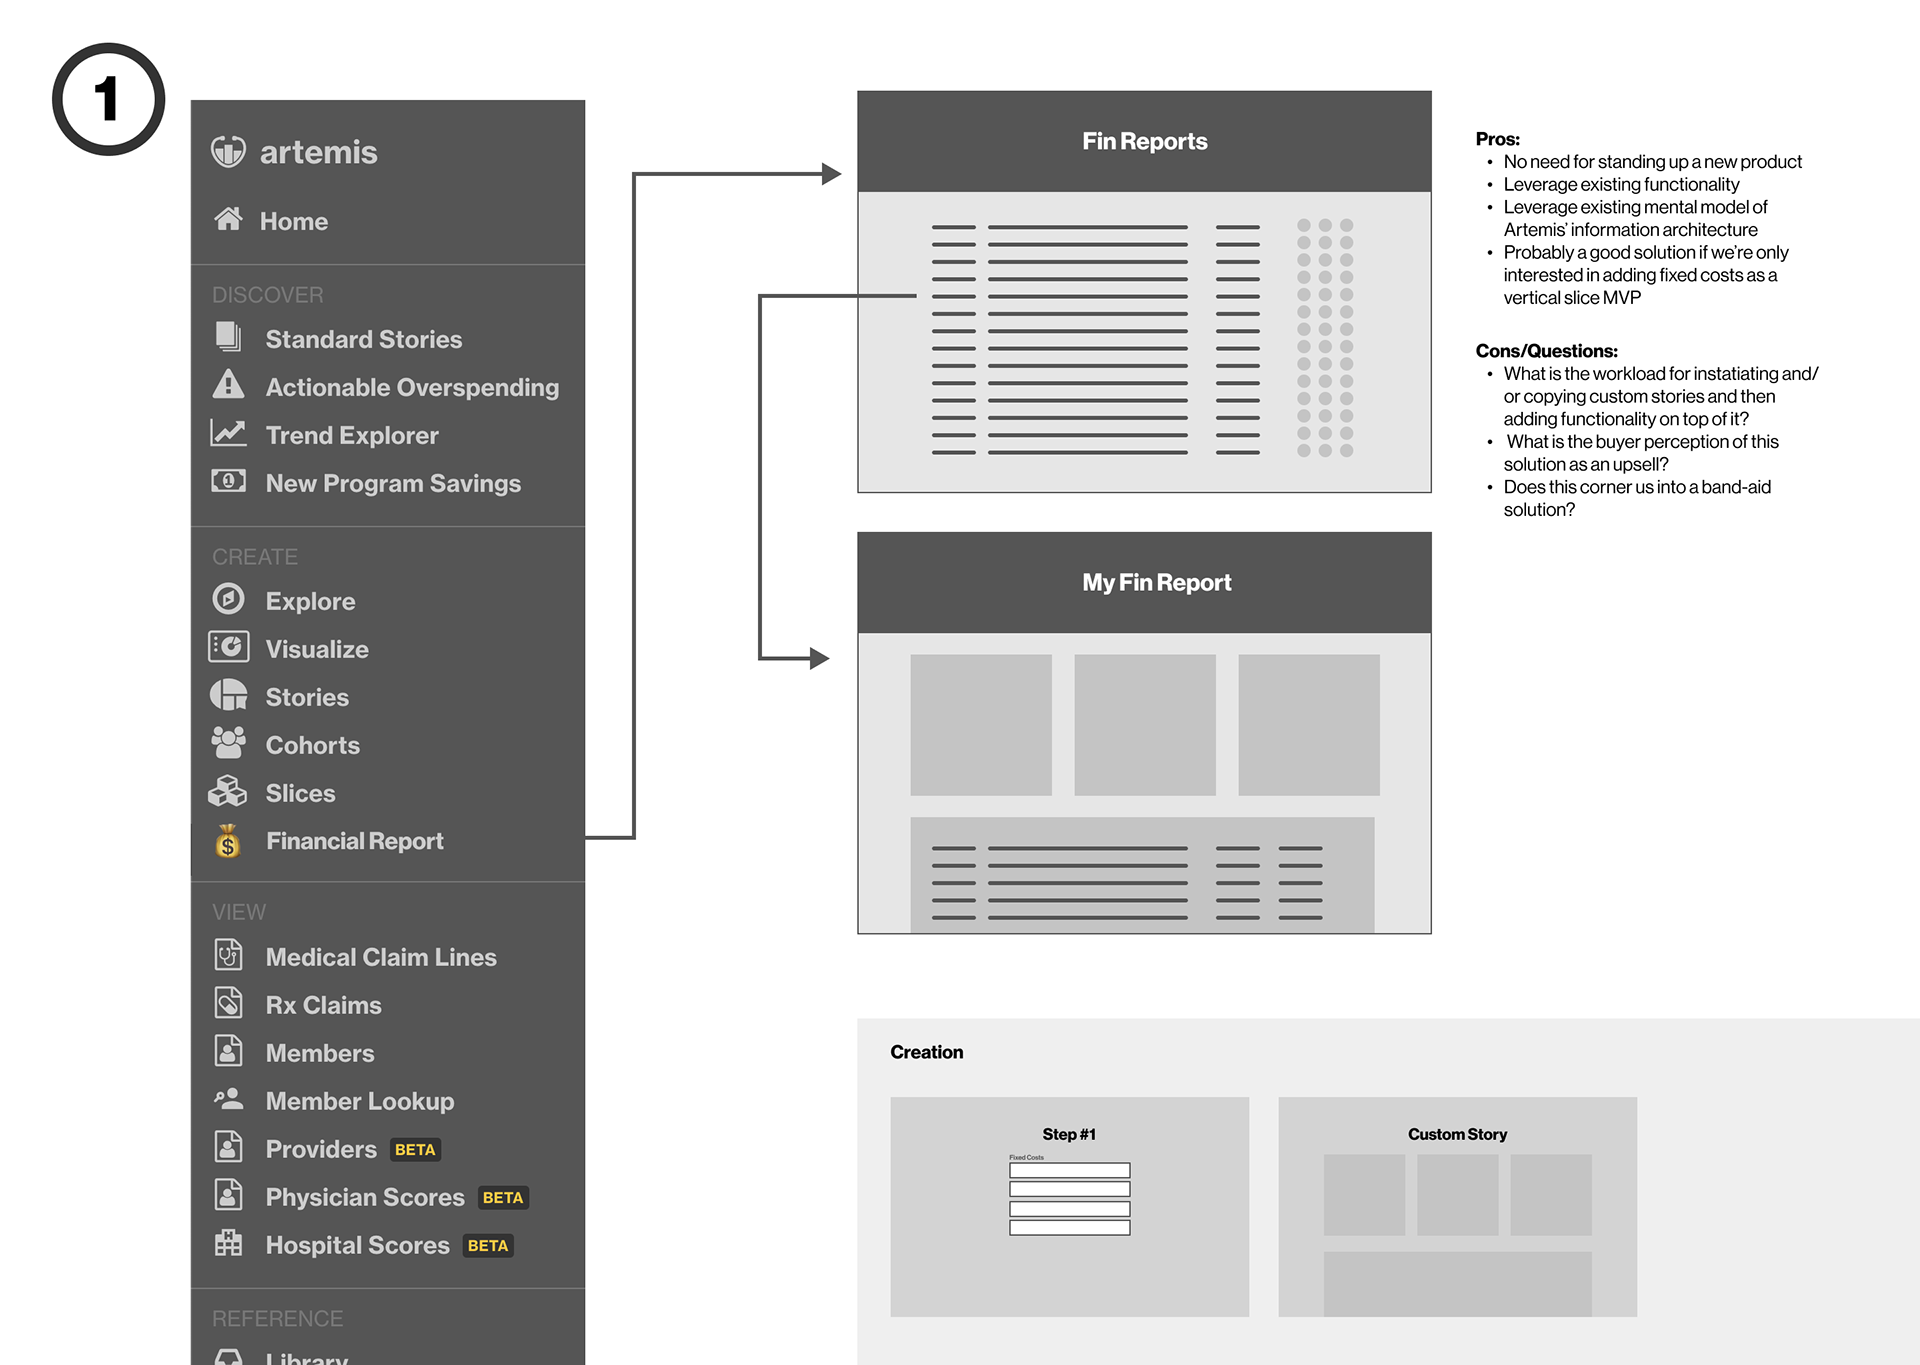
Naturally, as we explored the idea of different solutions, we began to describe what the user experience could look like and sketched various user flows. It was at this point that I began to flesh out those user flows in a node-based format using Figma to take back to the discovery group for initial validation.
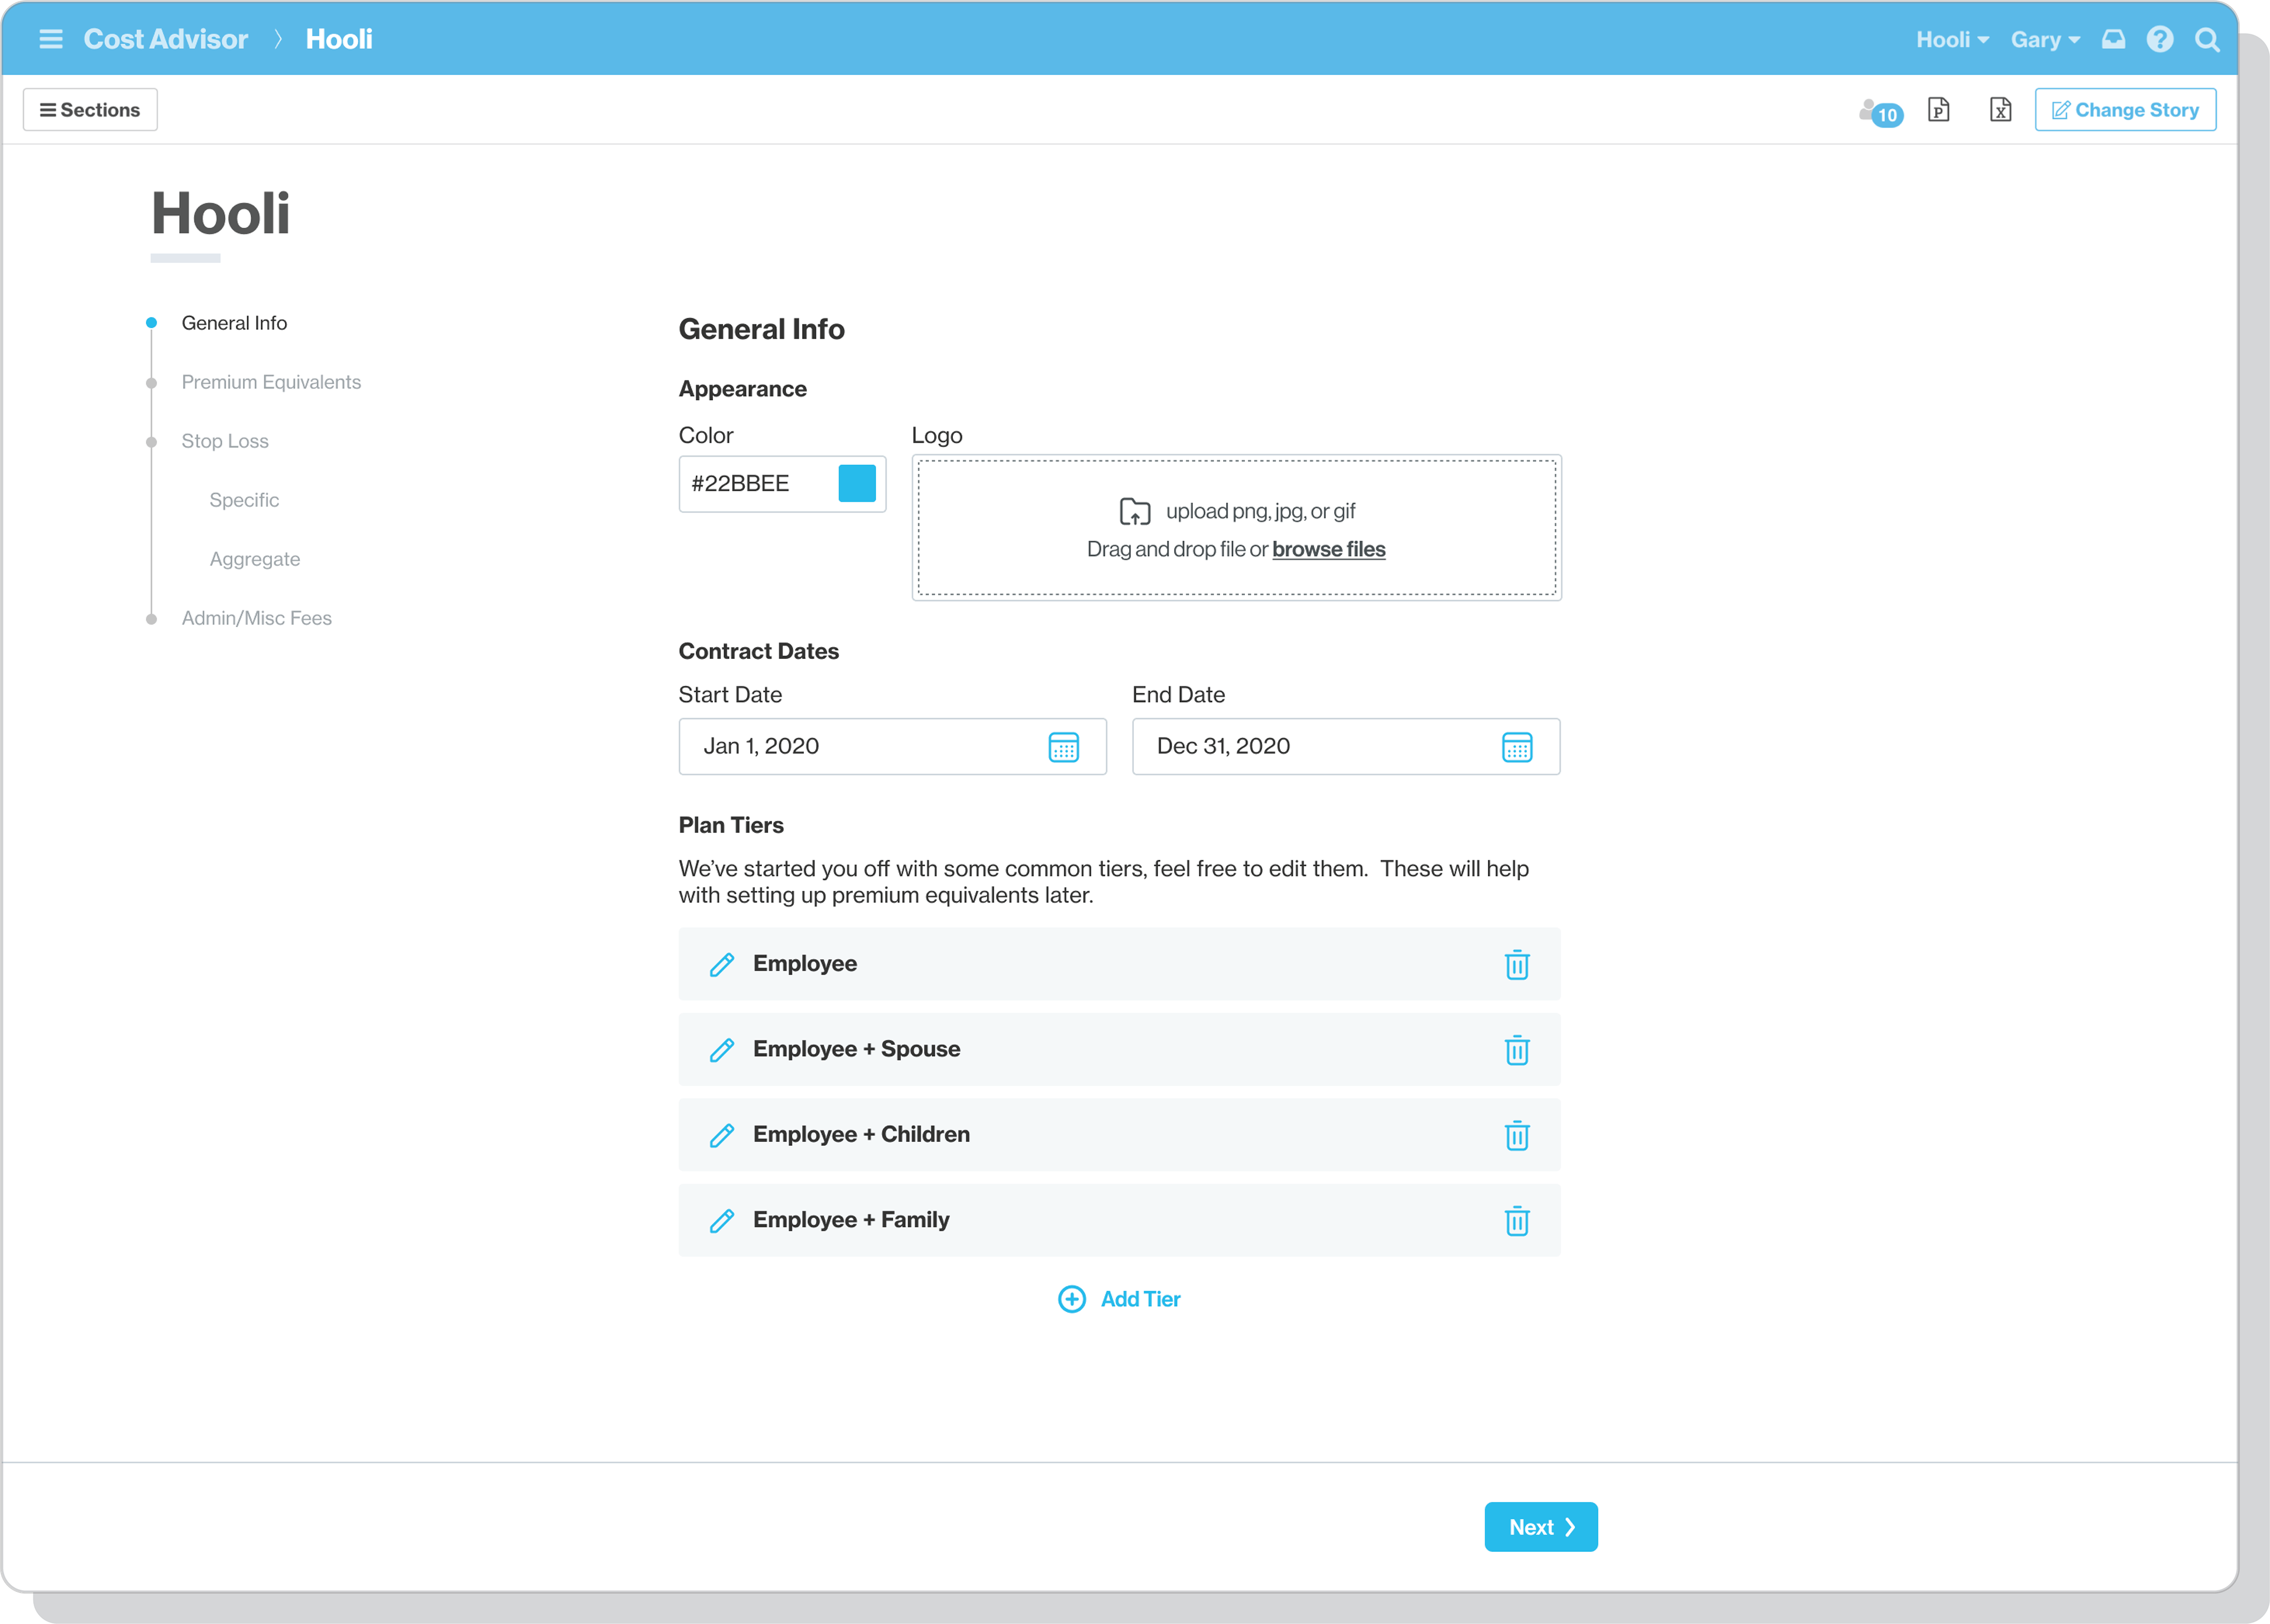
Simplifying Data Collection
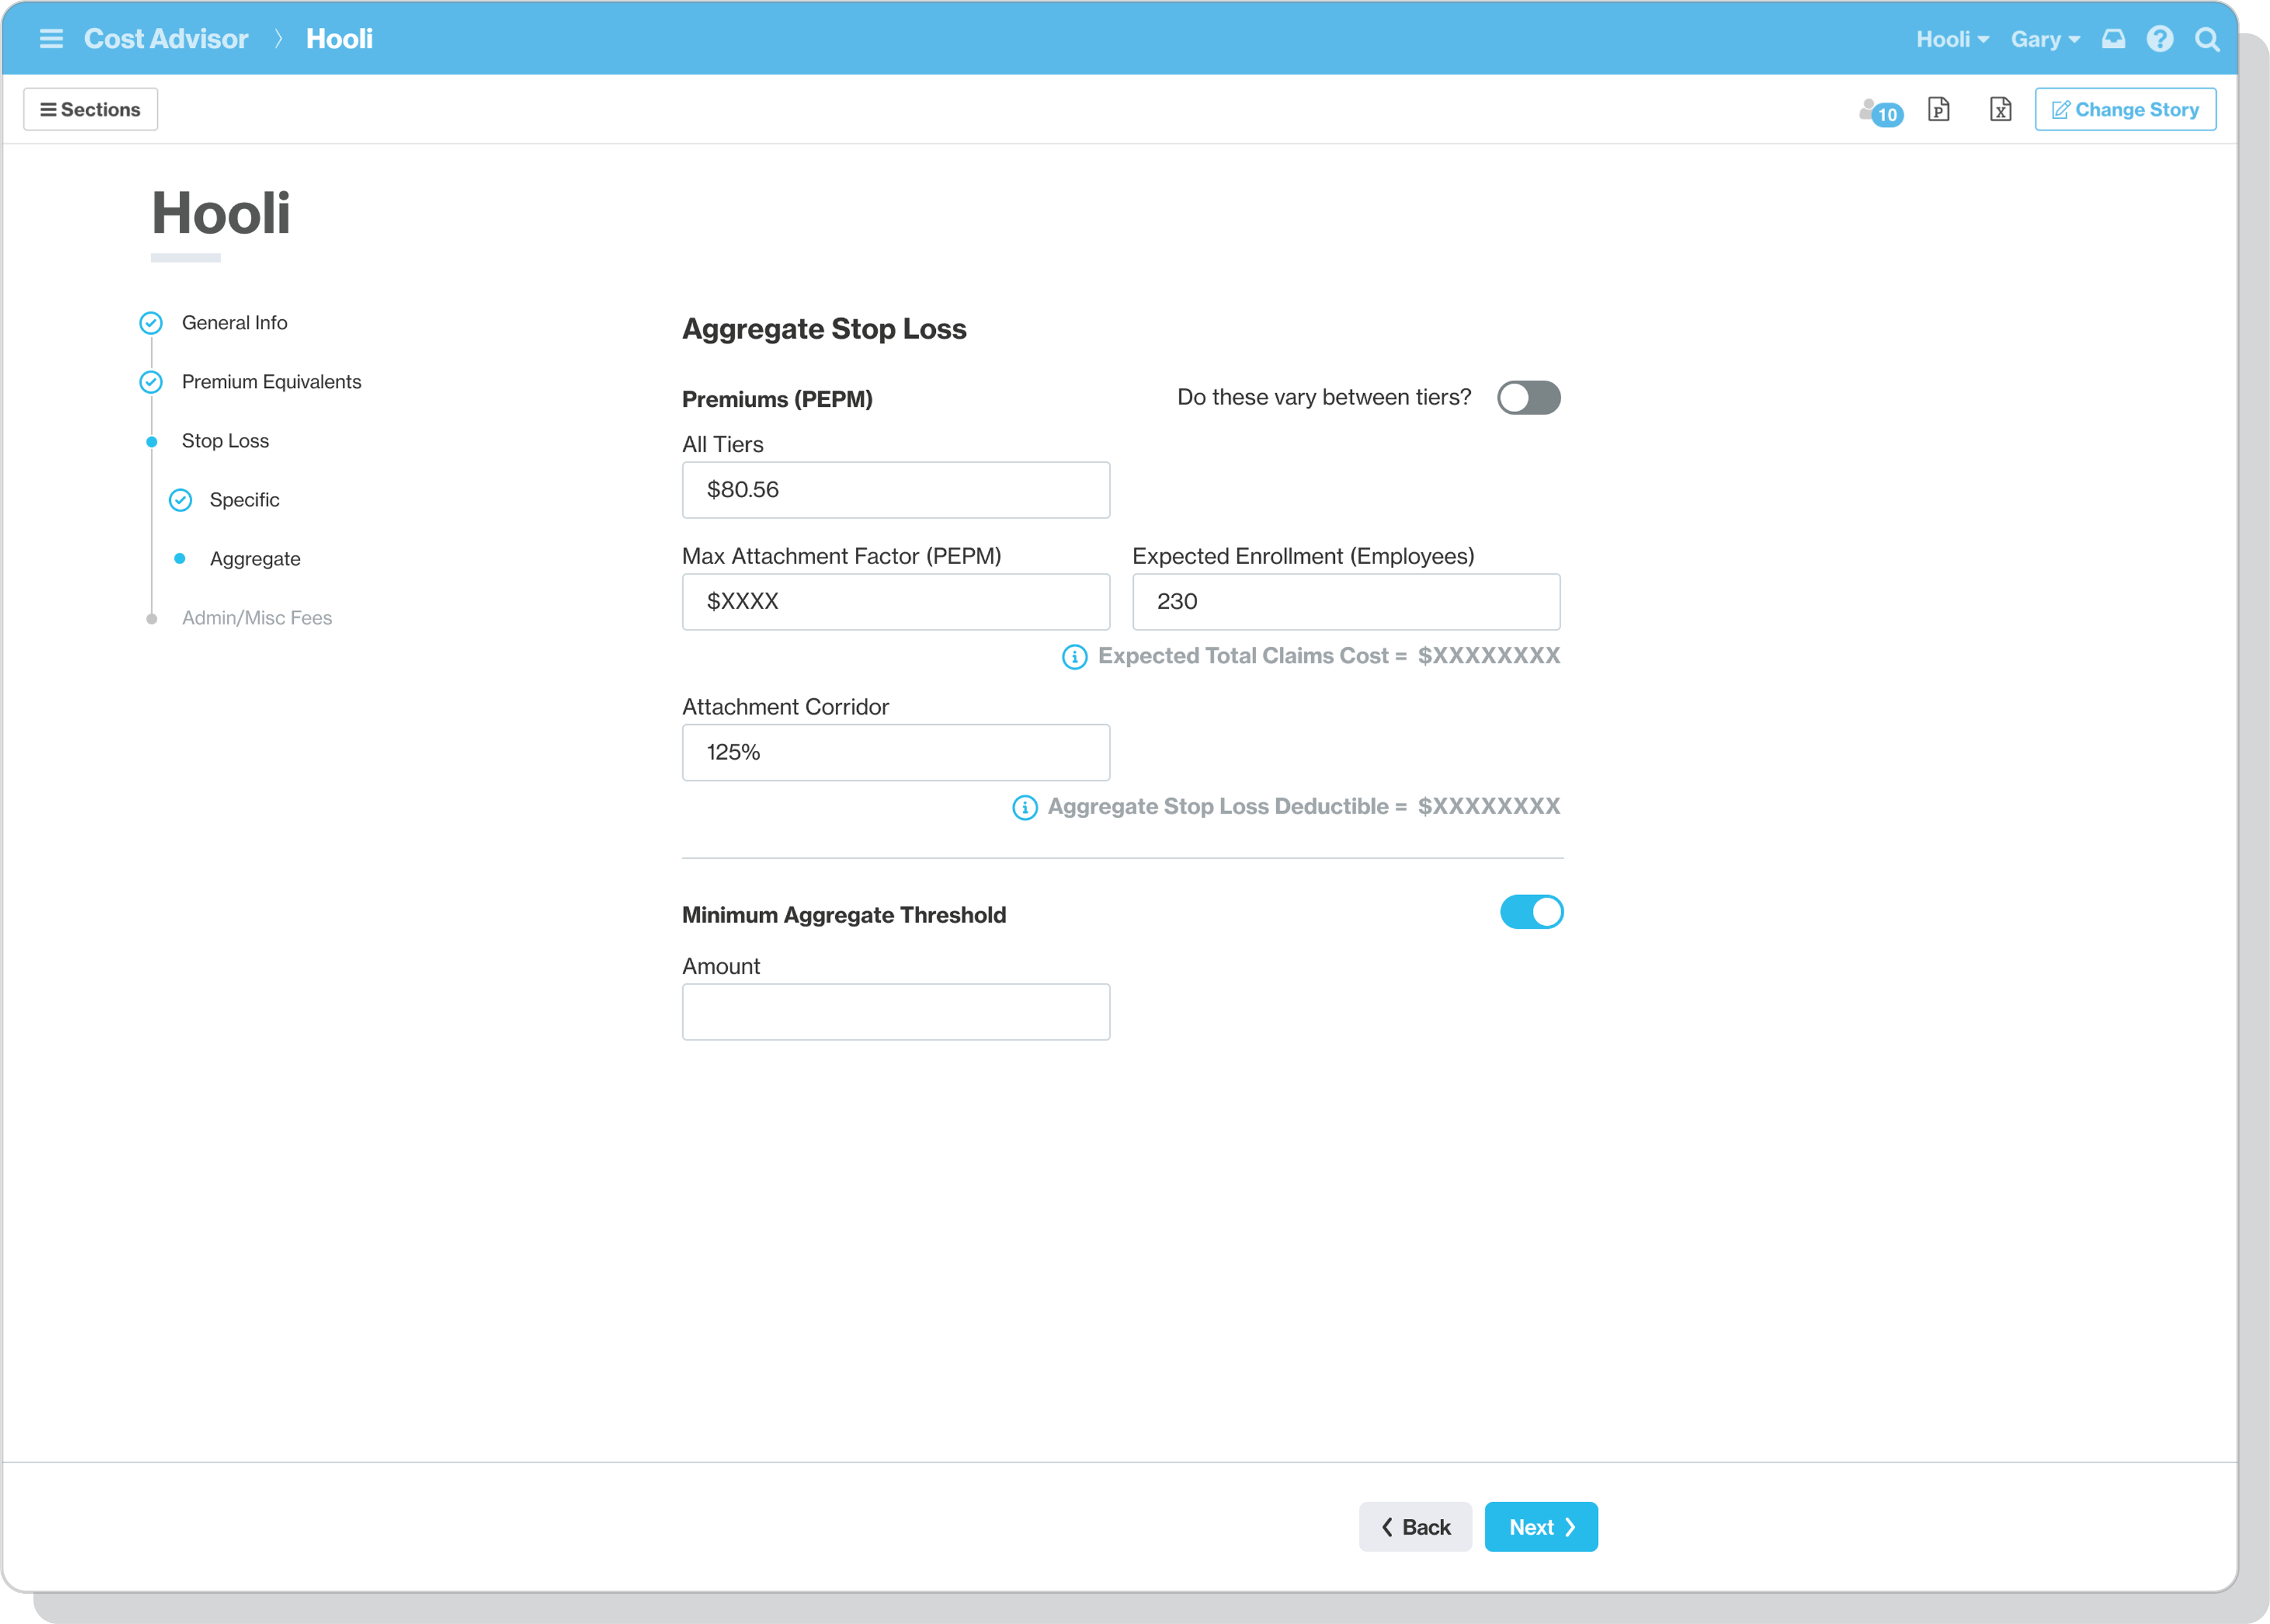
Due to the varying benefit offerings and plans of each client, data collection was always unique so I followed the idea of making report creation a stepped, wizard-type of format, where each step would adapt based on the previous step’s form entry.
Not only did the usability of this approach test well, but it would allow a user to only have to complete this setup once annually. From there we were able to automate the generation of their monthly report data, allowing consultants to spend 100% of their time each month refining the reports they were generating from the data.
Reporting & Customization
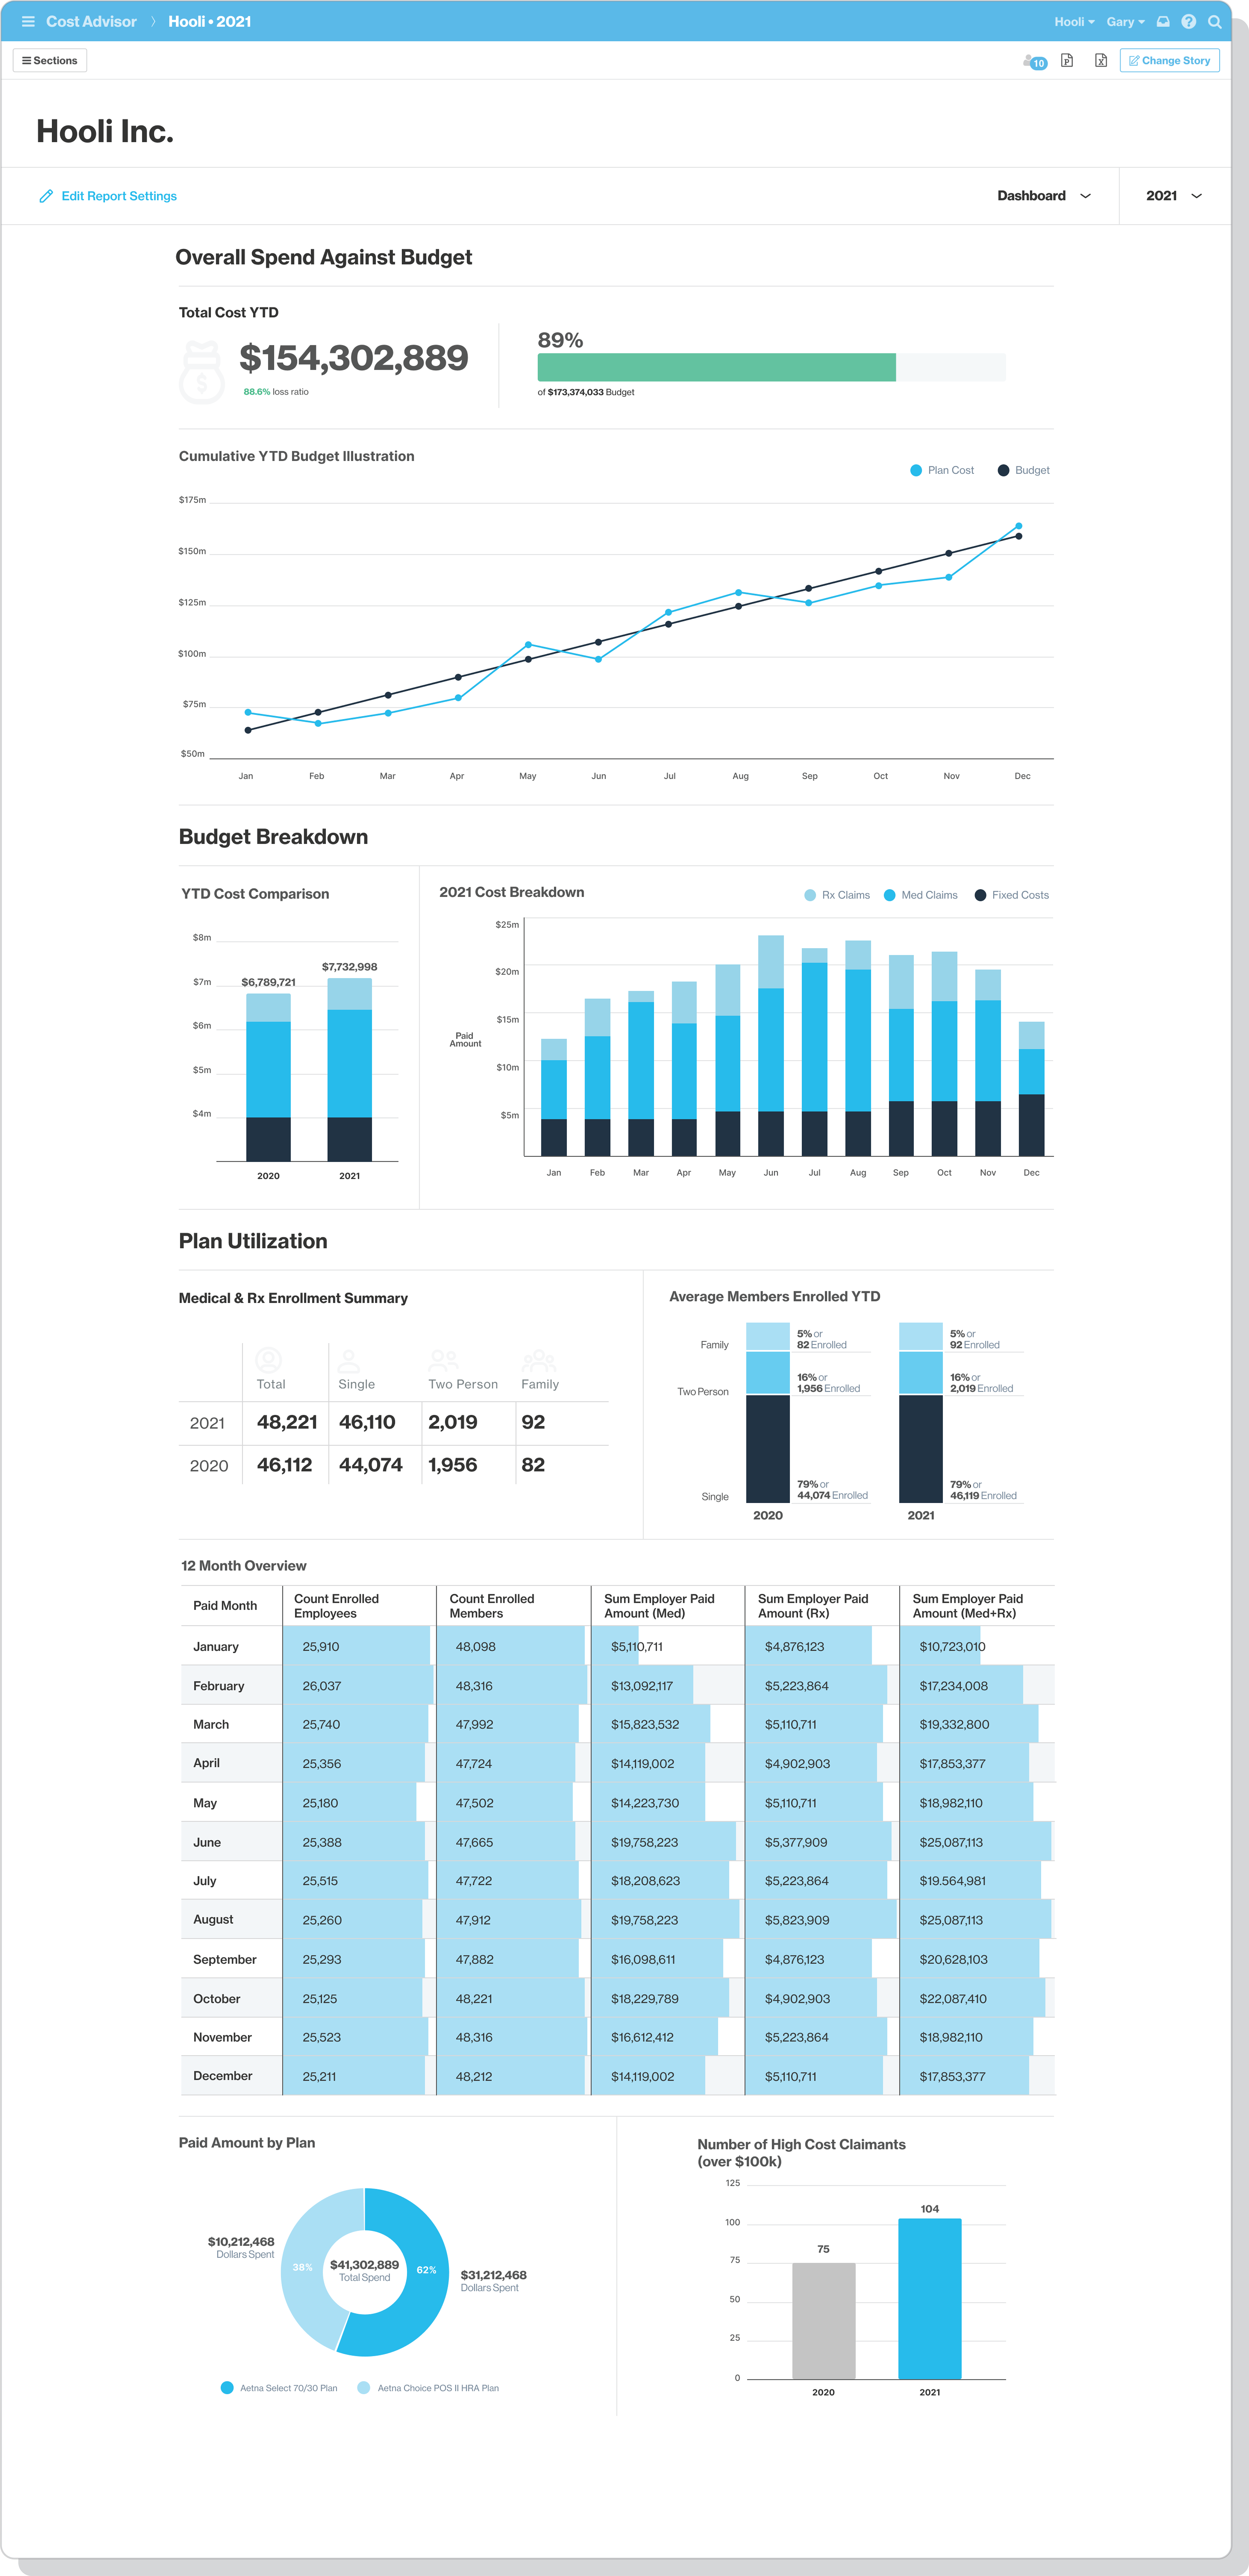
Once data automation and guided setup were in place report creation became the focus. Due to Artemis Health having an existing framework for report customization we were able to leverage the ability for users to create any report they could imagine, but during testing we learned that consultants wanted a starting point that answered the following:
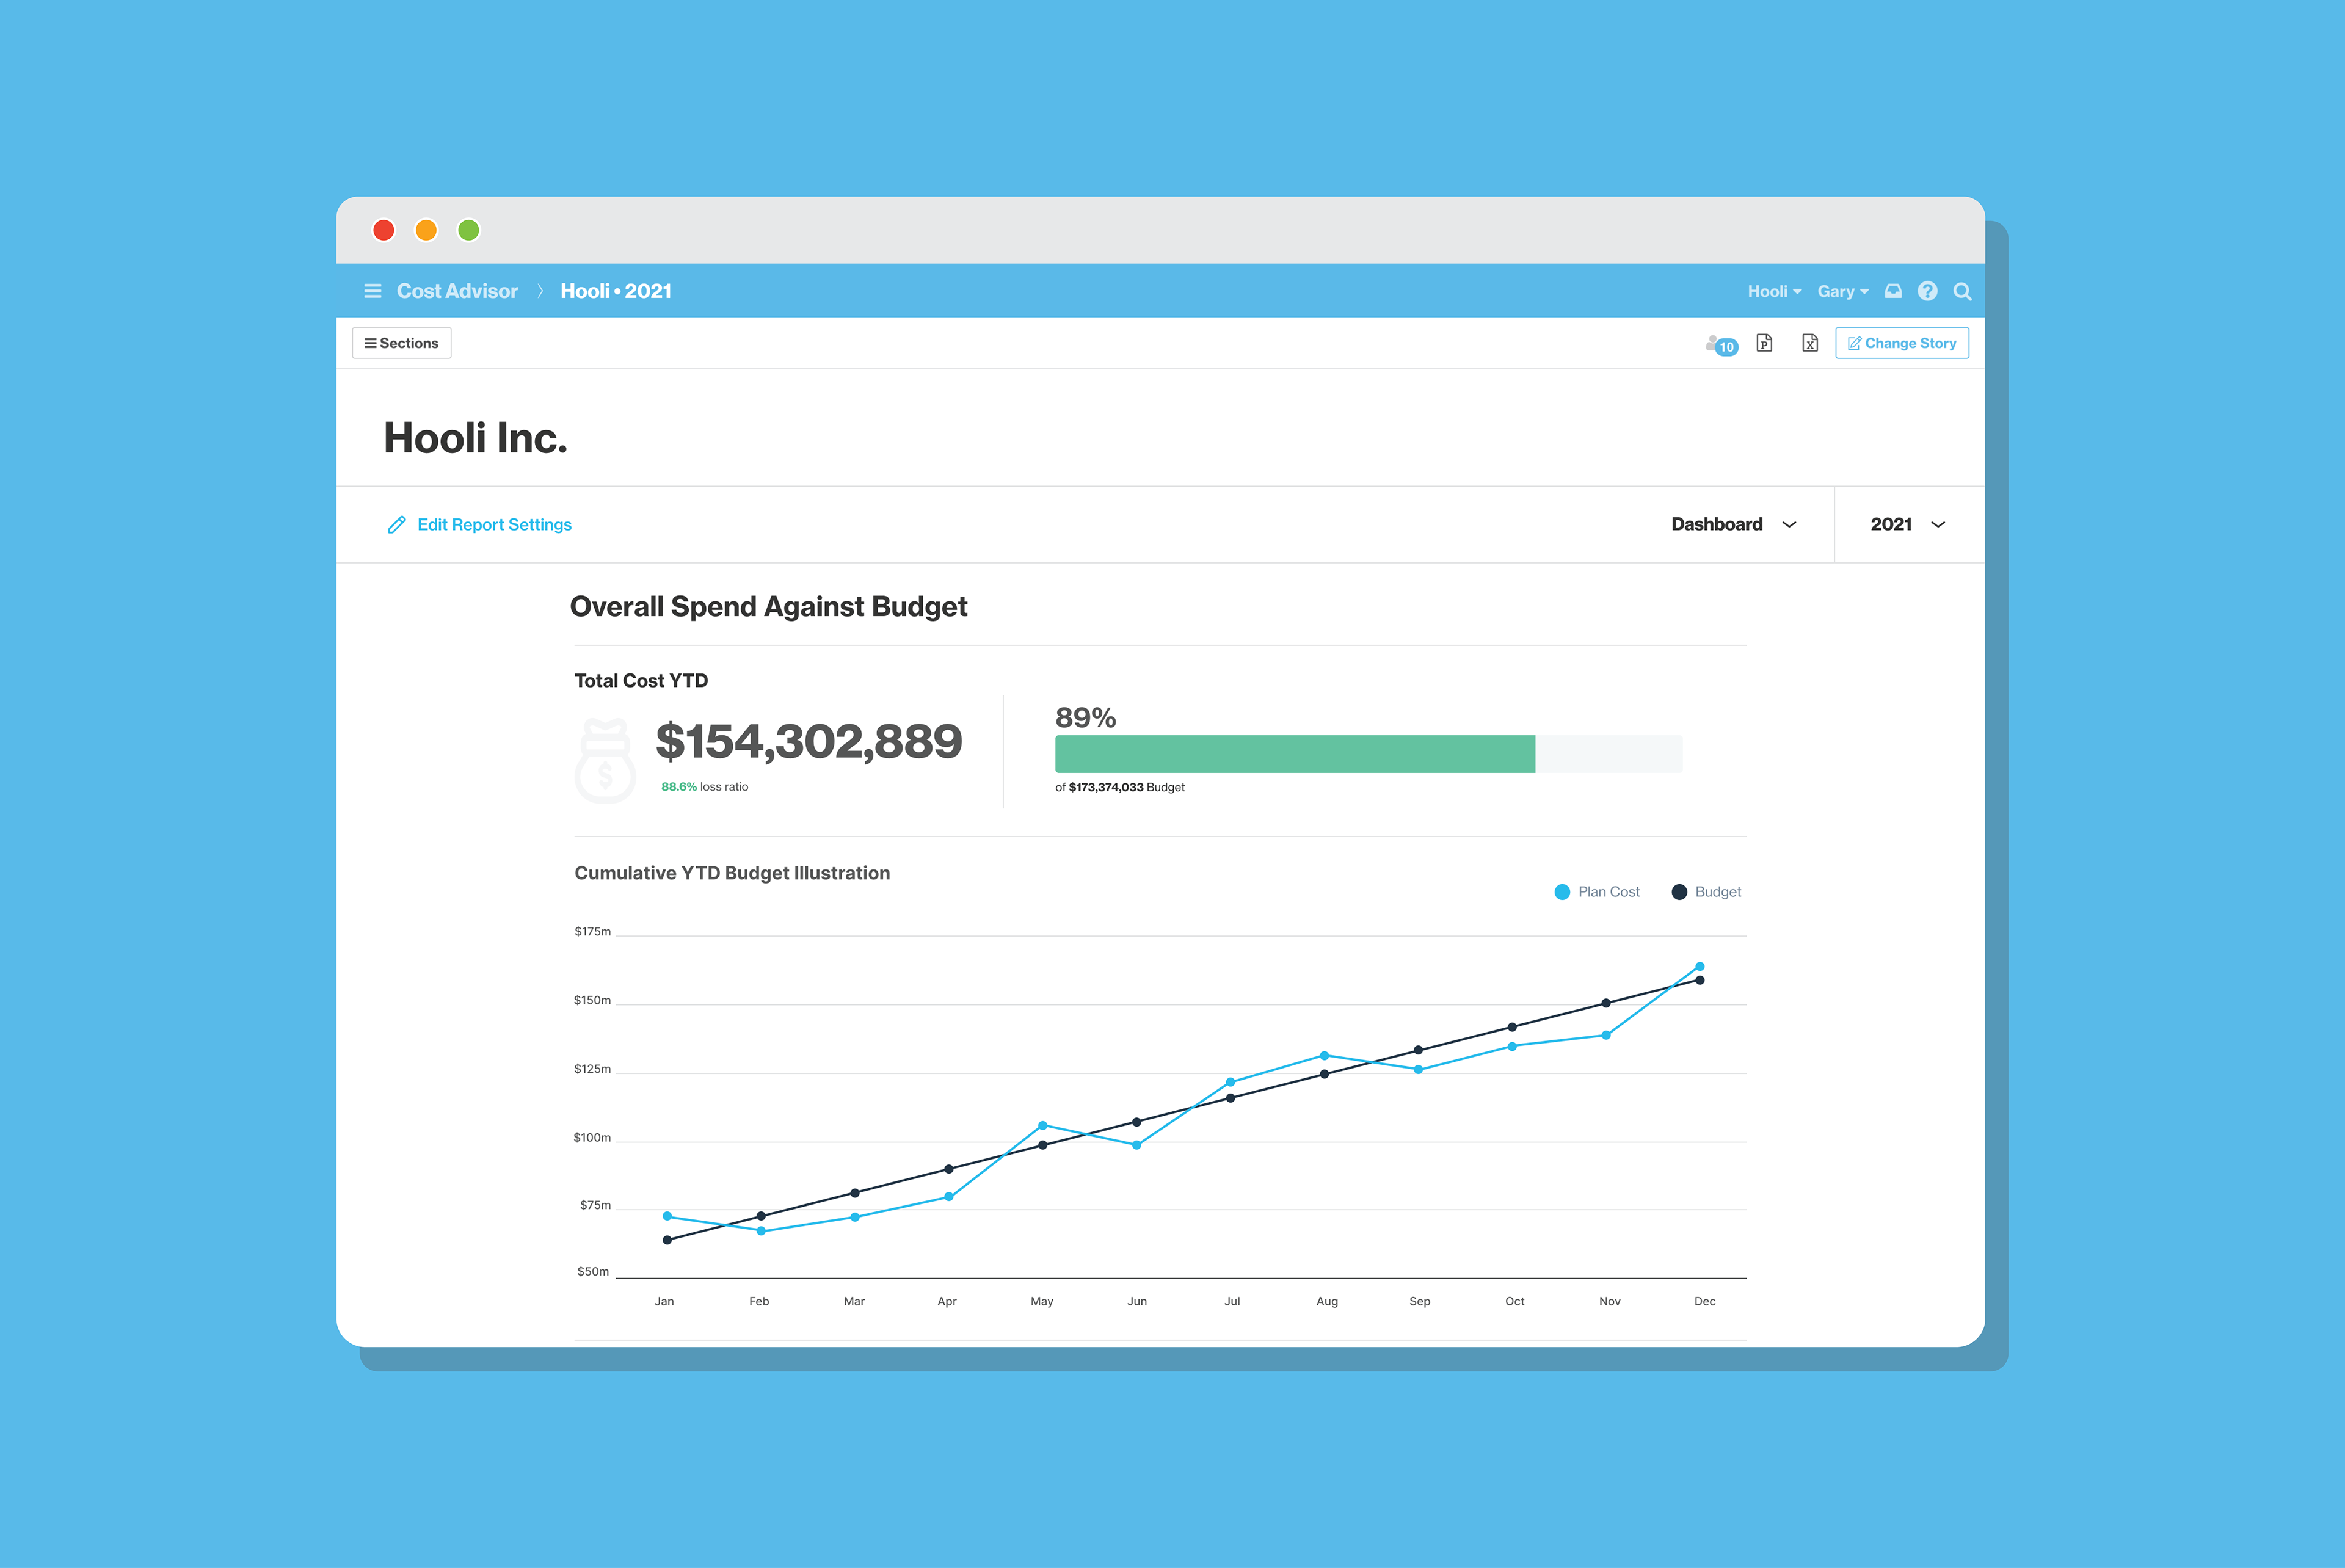
1•Am I projected to be on track or over my annual budget?
2•Are there any outliers on spending this month?
3•How much am I spending on average per employee per month?
4•What are my top 5 highest paid claims for the month?
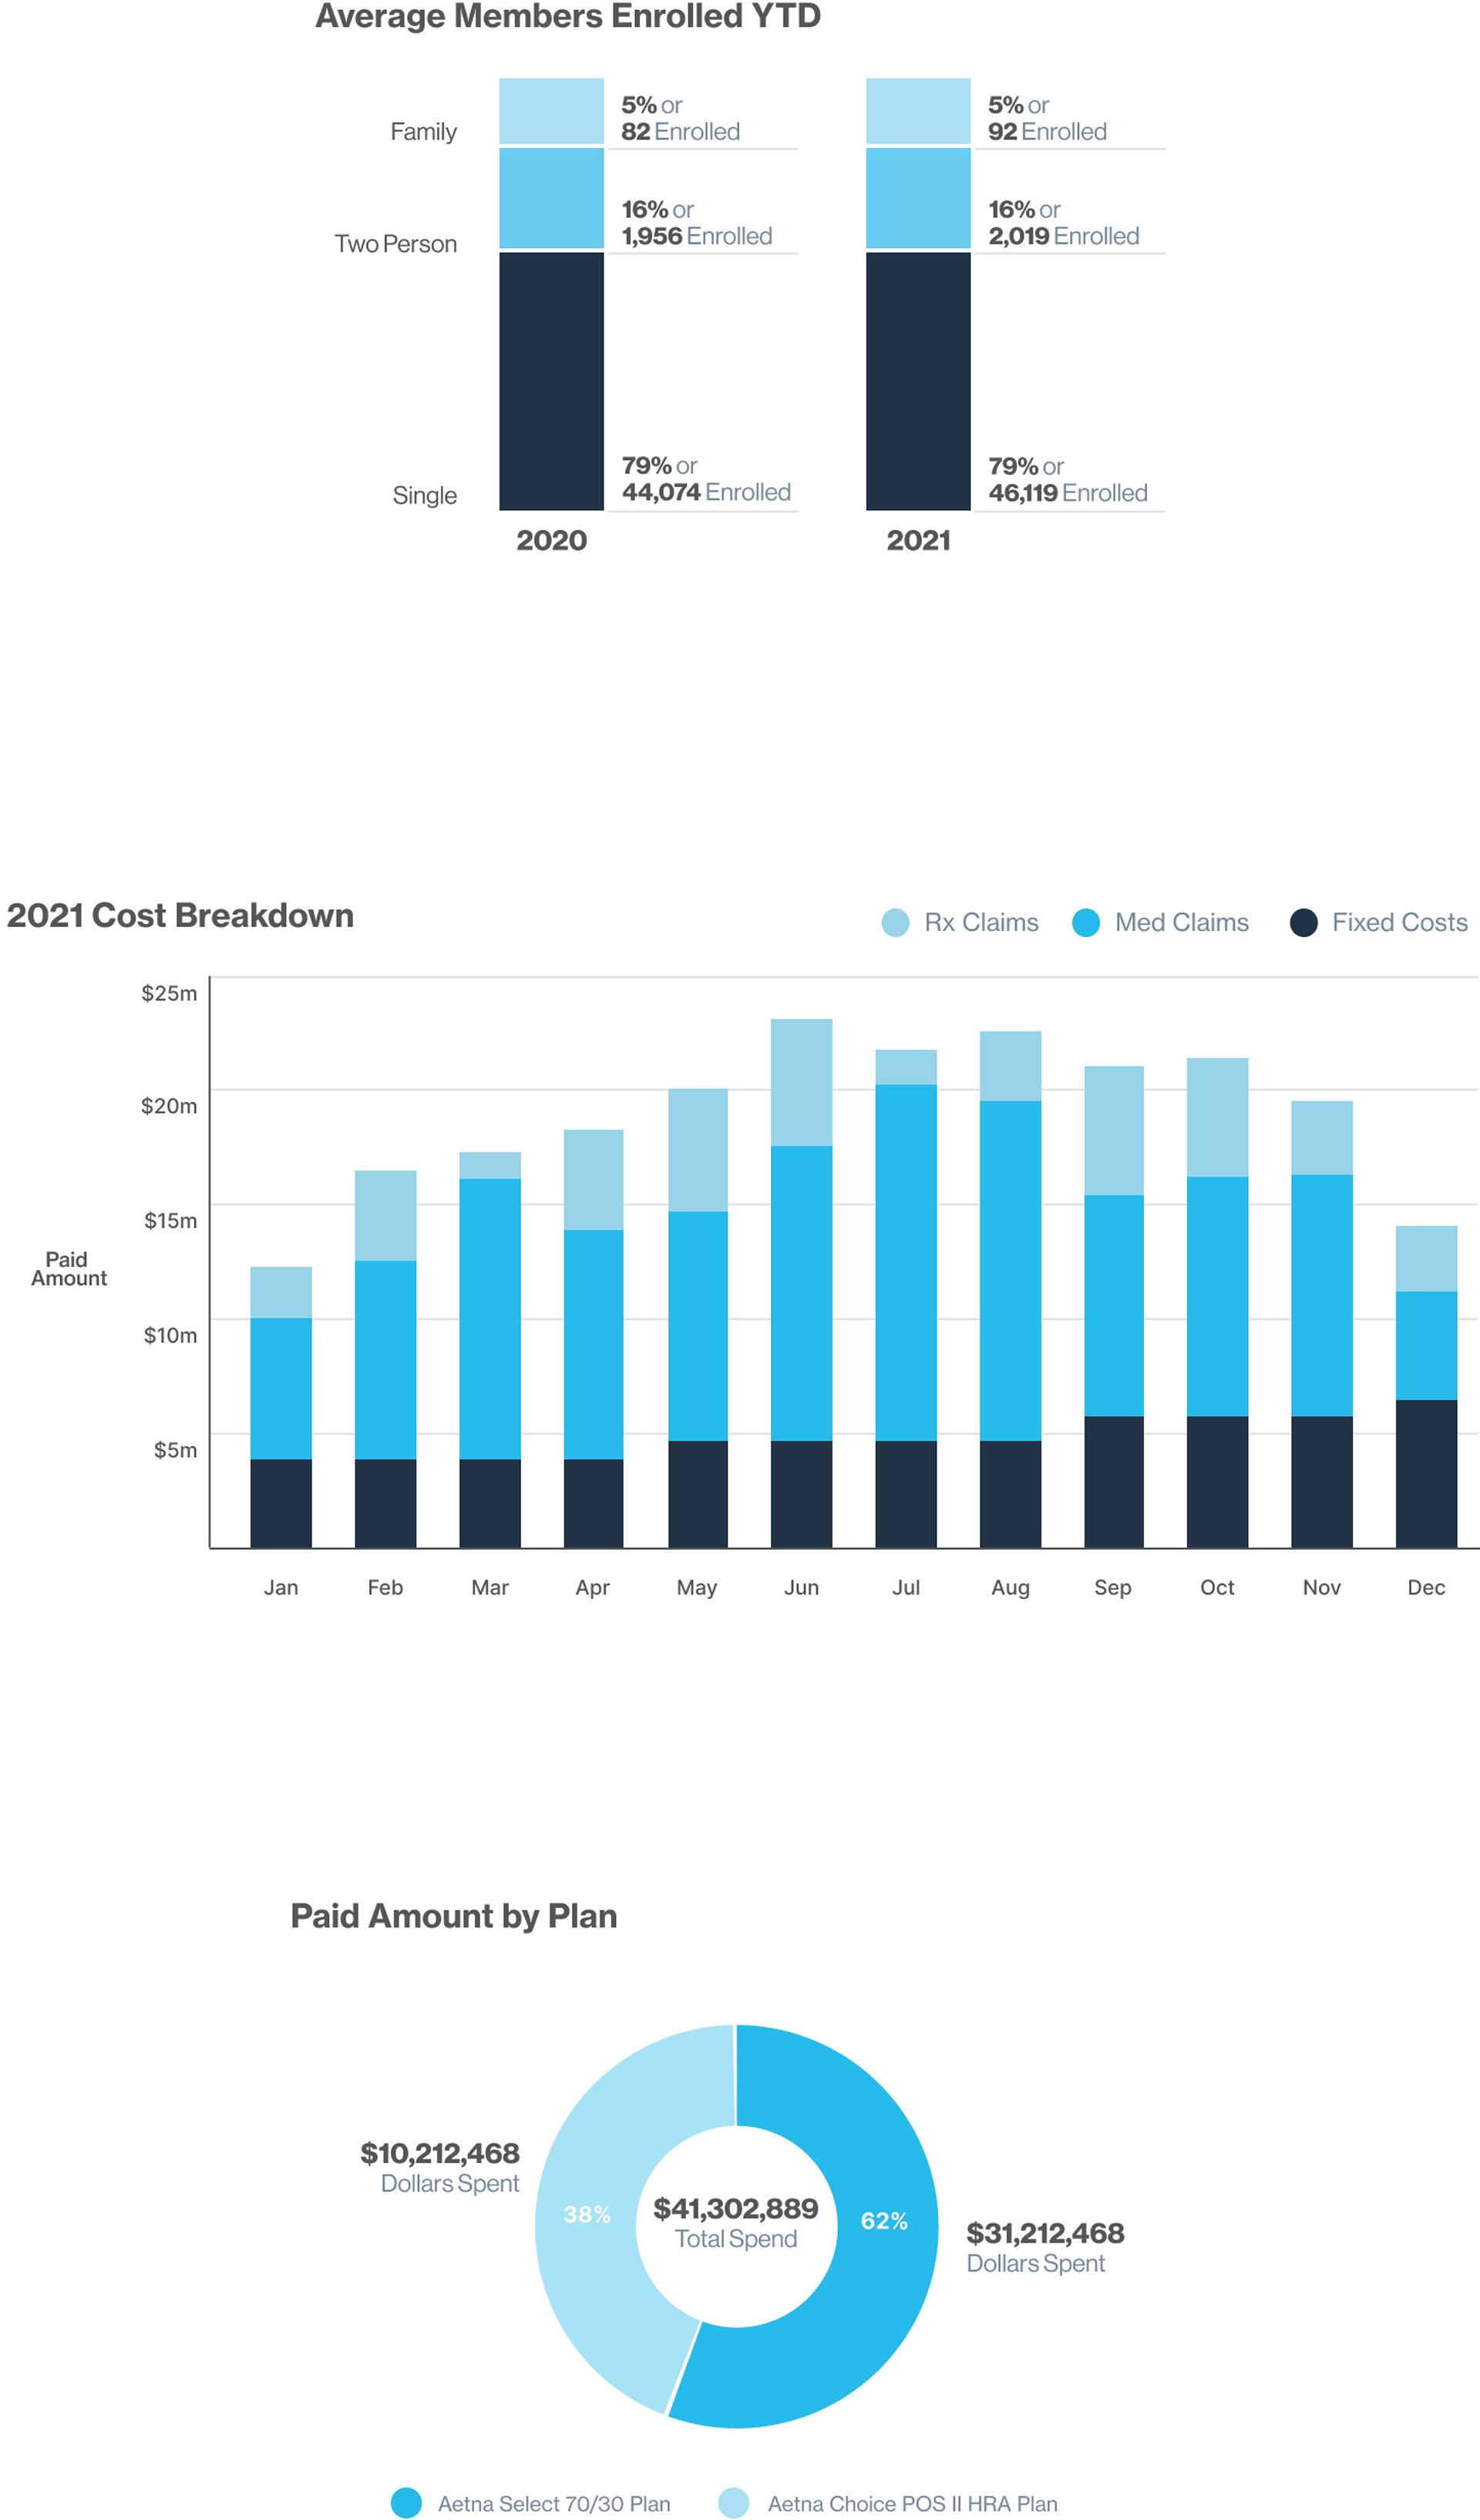
In knowing this, and considering that a primary problem we were out to solve was time savings, I then shifted my focus to creating beautiful, easily readable visualizations for displaying a narrative around general budget health.
Outcomes
After conducting thorough discovery, and designing a prototype that yielded great usability test results, we were confident that we had come up with an effective solution for benefits consultants. This was further proven to us as Artemis Health secured contracts with 2 of the nation’s largest healthcare consultancies to be our pilot customers for launch in July 2022.